

Ultimately, this is a result of the following factors;
(1) The difference between EBITDA and EBITA, which is depreciation expense, is also a significant fixed cost, leading to its concentration in the second half of the fiscal year.
(2) As the concentration in the second half of the fiscal year has accelerated from the previous year to the current year.
Let us explain each of these points.
(1) The difference between EBITDA and EBITA, which is depreciation expense, is also a significant fixed cost, leading to its concentration in the second half of the fiscal year.
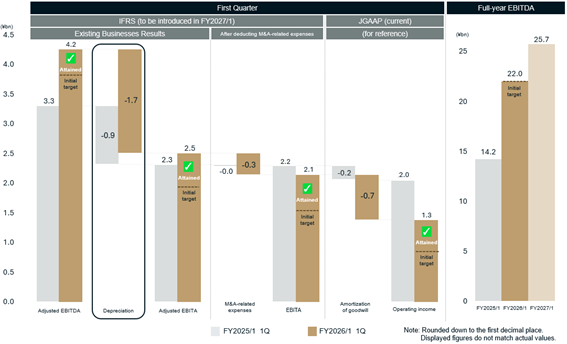
The important point is that “depreciation” remains roughly the same in 1Q, when sales are low, as it does in 4Q, when sales are at their highest.
EBITA, which is calculated by deducting the fixed cost of depreciation from EBITDA, will show an even greater concentration in the second half of the fiscal year compared to EBITDA.
Similarly, this trend further intensifies at each profit level.
For your reference, the main fixed costs at each profit level are shown below.
・Sales
-Rent
-Labor cost
・EBITDA
-Depreciation
・EBITA (operating income under IFRS)
-Interest
-(Amortization of goodwill in case of JGAAP)
・Net income
(2) As the concentration in the second half of the fiscal year has accelerated from the previous year to the current year.
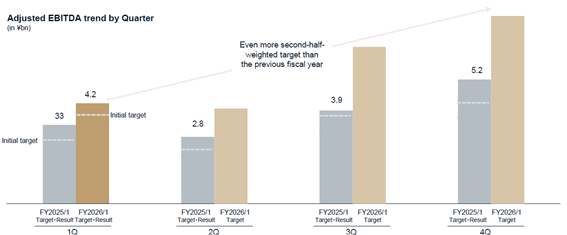
(Source: page 6 of “FY2026/1 1Q Earnings Presentation” disclosed on June 11, 2025)
https://ssl4.eir-parts.net/doc/9166/ir_material_for_fiscal_ym2/181316/00.pdf#page=6
This will be explained using information from the earnings presentation.
・Changes in the composition of store size
-Our long-standing GiGO brand stores are primarily large-format stores.
-Meanwhile, the stores added through M&A activities are comparatively smaller.
・Resulting change in the break-even point ratio
-Smaller stores have a higher break-even point compared to larger stores (due to a higher proportion of fixed costs).
-Therefore, during the off-season in the first half of the fiscal year when sales are low, it becomes even more challenging to generate profit.
-Conversely, during the sales season in the second half of the fiscal year when sales are high, significant earnings are generated.
As a result, with the increasing proportion of smaller stores due to M&A, isolating the three months of 1Q (a slow season) will show an even stronger tendency for lower profit levels.