

Company Information
We had already announced in the second quarter financial results that we would pay dividends from each group company to increase the distributable amount, and this was completed in October, the end of the third quarter.
As mentioned in the “Frequently Asked Questions and Answers” in September 2025, generally, we have to wait until the fiscal year-end closing (the fiscal year ending on January 31, 2026). However, since we are afraid that this will delay the implementation of our agile capital policy, we plan to conduct an extraordinary closing after the announcement of the third quarter financial results, which will be announced in December this year.
Through this extraordinary closing, we aim to raise the distributable amount to an appropriate level.
Once these preparations are in place, we will consider implementing a share repurchase at an appropriate time, comprehensively taking into account the market environment and financial conditions.
M&A Strategy
The main reason for raising funds by issuing corporate bonds is to maximize our debt capacity by diversifying our financing sources.
With M&A as the core of our growth strategy, we have maintained financial discipline and continued to grow by striking a good balance between debt financing, mainly through bank loans, equity financing through follow-on offerings, and stock deal M&A.
We have historically preferred to finance our M&A transactions using a “bridge loan” – a temporary borrowing of acquisition funds from a small number of banks – from the perspective of speed and information management, and have executed past borrowings accordingly.
For a bank which provides a short-term “bridge loan,” a key factor in deciding whether to approve the loan is the assurance of whether the “bridge loan” can be refinanced into a long-term “permanent loan.” From this perspective, we believe that the ability to utilize (not only bank financing but also) corporate bonds for “permanent loans” will lead to maximization of debt capacity.
Moreover, we believe that diversifying financing sources is also important from the perspective that it leads to increased negotiating power with financial institutions.
Furthermore, although our company is currently only in its eighth year since founding, we believe that the smooth accumulation of future earnings will allow our current investment-grade credit rating of “BBB+” from Japan Credit Rating Agency, Ltd. (JCR) to rise to the “A” rating zone – the volume zone of the corporate bond market – ultimately leading to the maximization of our debt capacity.
Financial Results
Since our listing, as a company which continuously conducts M&A while adhering to Japanese GAAP (JGAAP), we have made efforts to enhance our disclosures.
Specifically, we have (1) indicated cash flow indicators and (2) shown intrinsic performance excluding one-off M&A costs.
Regarding (1), we have shown earnings that indicate cash flow before “goodwill amortization expense” is deducted, because under Japanese GAAP (JGAAP), goodwill amortization expense, which has no cash outflow, is recorded as a cost.
For (2), we have been presenting “adjusted” profit indicators, which are indicators calculated before the deduction of one-off costs such as M&A fees, etc., in order to show the true performance of our existing businesses.
However, we have received comments that the additional disclosure of the above indicators has resulted in excessive and complicated information.
Therefore, we have decided to narrow down our presentation to the following KPI indicators to show our actual earning capacity, while taking into account (1) and (2) again.
- Revenue
- Adjusted EBITDA
- Adjusted net income (The current “Adjusted net income before amortization of goodwill” will be referred to as “Adjusted net income”)
- Adjusted EPS (The current “Adjusted Cash EPS” will be referred to as “Adjusted EPS”)
About i.ii.iii.
Beginning with the next fiscal year (ending on January 31, 2027), we will only disclose these three indicators in the company’s earnings forecast at the beginning of the fiscal year. Until the current fiscal year, we have not been able to incorporate the current performance into our forecasts because we could not predict whether there would be any one-off expenses from M&A during the fiscal year. Starting next fiscal year, by using only the adjusted KPI indicators in our forecasts, it will become unnecessary to predict the presence or absence of one-off expenses from M&A activities during the fiscal year, thereby allowing us to reflect our current business performance in the earnings forecast.
In addition, considering the introduction of IFRS from the end of the next fiscal year, the company’s forecasted net income will be closer to the IFRS net income excluding amortization of goodwill, which will bring the P/E multiple of the company’s forecast closer to the IFRS standard.
About iv.
As an M&A company, we also believe that it is natural for the company’s sales and earnings to increase in a transformational way as a result of the consolidation of the earnings of newly consolidated companies.
On the other hand, in our M&A activities, there is also an increase in the number of shares due to stock deal M&A and follow-on offerings. Therefore, it is important to show whether earnings growth exceeds the increase in the number of shares and leads to an increase in EPS, the value per share.
Conversely, we believe that no matter how much earnings increase, if the number of shares increases more than that, it is not growth. Based on this, we also use adjusted EPS as a KPI.
For your reference, the following is an excerpt from a past presentation showing our adjusted EPS transition (current adjusted Cash EPS).
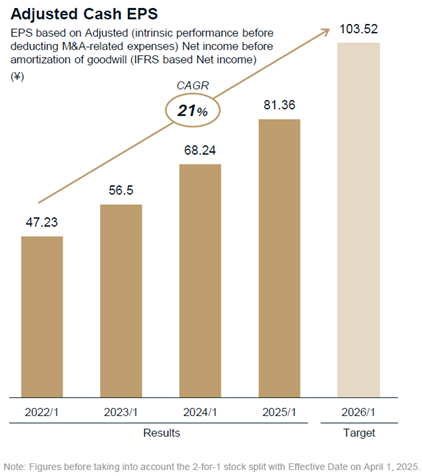
(Reference: page 11 of “M&A Announced today” disclosed on April 9, 2025)
This presentation was prepared prior to the follow-on offering conducted last May, but by utilizing all of the funds raised through that offering for M&A, we aim to maximize our Adjusted EPS starting from the fiscal year ending on January 31, 2027.
Business
In conclusion, as this figure is incorrect, we will request MSCI to correct this figure based on this timely disclosure.
We have no gambling-related sales to begin with. Even if our amusement poker business were deemed to fall under that category, it would only account for 0.1% of consolidated revenue. Please let us provide the details below.
Currently, MSCI states that our gambling revenue exposure accounts for “5 to 9.99%” of consolidated revenue. Due to this classification, we have been advised by certain institutional investors that they are unable to purchase our shares.
Upon contacting MSCI, we learned that our amusement poker room (GiGO POKER) was deemed to be equivalent to gambling, and since the revenue from GiGO POKER was not clearly disclosed, they provisionally classified our gambling revenue exposure as “5 to 9.99%.”
MSCI requested that public disclosure of the relevant data was necessary to reflect a correction in the ratio.
In response, we have explicitly stated this ratio through this timely disclosure.
The sales ratio of our amusement poker room to our consolidated revenue is approximately “0.1%”
(Annual amusement poker room revenue of approximately 0.2 billion yen ÷ Revenue for the fiscal year ending on January 31, 2025 of 111.7 billion yen = approximately 0.1%)
Furthermore, we anticipate sales of approximately 200.0 billion yen for the next fiscal year, which will cause this ratio to decline even further.
With this disclosure, we will promptly proceed with the formal procedures to request MSCI to correct the classification once again. Once this correction is implemented, we will approach institutional investors again who were restricted from purchasing our shares due to investment mandate constraints.
As a prerequisite, please kindly note that our “GiGO POKER” is operated strictly in compliance with relevant Japanese laws as an amusement facility. We do not engage in any exchange of cash or equivalents that would constitute gambling, and therefore our business does not fall under the category of “gambling.”
(For reference) MSCI Inc. is a company that manages indices, such as the “MSCI All Country World Index,” which are adopted globally investors and mutual funds as investment management standards. The total assets currently benchmarked to MSCI indices boast approximately 18.3 trillion U.S. dollars (around 2,745 trillion yen).